


Physics Toolbox Sensor Suite

Mô tả của Physics Toolbox Sensor Suite
Ứng dụng này sử dụng các cảm biến bên trong điện thoại thông minh để thu thập, hiển thị, ghi và xuất các tệp dữ liệu .csv. Xem www.vieyrasoftware.net để (1) đọc về cách sử dụng tình huống trong nghiên cứu và phát triển, và (2) nhận giáo án cho các nhà giáo dục về khoa học, công nghệ, kỹ thuật và toán học (STEM), bao gồm cả vật lý. Tính khả dụng, độ chính xác và độ chính xác của cảm biến phụ thuộc vào phần cứng của điện thoại thông minh.
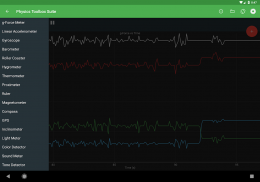
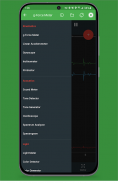
Bộ cảm biến, bộ tạo và các công cụ phân tích dữ liệu bao gồm:
KINEMATICS
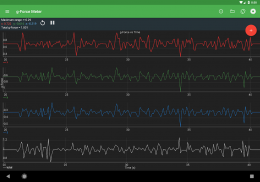
G-Force Meter - tỷ lệ Fn / Fg (x, y, z và / hoặc tổng)
Gia tốc kế tuyến tính - gia tốc (x, y và / hoặc z)
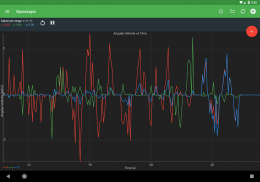
Con quay hồi chuyển - vận tốc hướng tâm (x, y và / hoặc z)
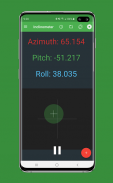
Máy đo độ nghiêng - phương vị, cuộn, cao độ
Thước đo góc - góc từ dọc hoặc ngang
ACOUSTICS
Máy đo âm thanh - cường độ âm thanh
Máy dò giai điệu - tần số và giai điệu âm nhạc
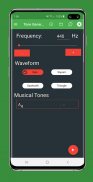
Tone Generator - nhà sản xuất tần số âm thanh
Máy hiện sóng - hình dạng sóng và biên độ tương đối
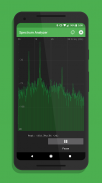
Máy phân tích phổ - FFT đồ họa
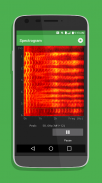
Quang phổ - FFT thác nước
ÁNH SÁNG
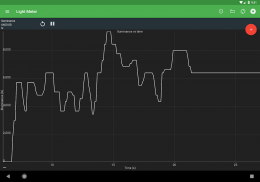
Đồng hồ đo ánh sáng - cường độ ánh sáng
Máy dò màu - phát hiện màu HEX trong một khu vực hình chữ nhật nhỏ trên màn hình thông qua máy ảnh.
Trình tạo màu - R / G / B / Y / C / M, màn hình màu trắng và tùy chỉnh
Proximeter - chuyển động tuần hoàn và bộ đếm thời gian (chế độ bộ đếm thời gian và con lắc)
Stroboscope (beta) - đèn flash máy ảnh
Wi-Fi - Cường độ tín hiệu Wi-Fi
THUẬT NGỮ
La bàn - hướng từ trường và mức bong bóng
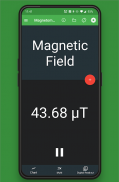
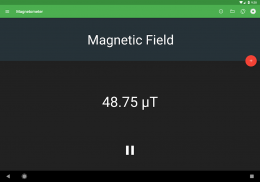
Từ kế - cường độ từ trường (x, y, z và / hoặc tổng)
Magna-AR - hình ảnh thực tế tăng cường của vectơ từ trường
KHÁC
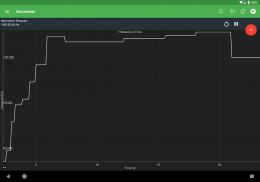
Phong vũ biểu - áp suất khí quyển
Thước - khoảng cách giữa hai điểm
GPS - vĩ độ, kinh độ, độ cao, tốc độ, hướng, số lượng vệ tinh
Nhiệt độ hệ thống - nhiệt độ pin
KẾT HỢP
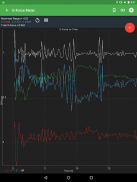
Multi Record - chọn một hoặc nhiều cảm biến ở trên để thu thập dữ liệu cùng một lúc.
Cảm biến kép - hiển thị dữ liệu từ hai cảm biến trên biểu đồ trong thời gian thực.
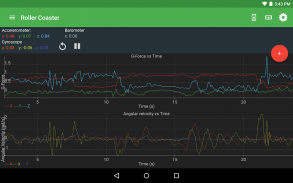
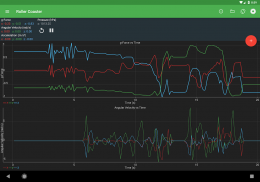
Tàu lượn siêu tốc - G-Force Meter, Linear Accelerometer, Gyroscope và Barometer
LẮP RÁP
Ô dữ liệu thủ công - nhập dữ liệu theo cách thủ công để tạo biểu đồ.
TRÒ CHƠI
Chơi - thử thách
CÁC TÍNH NĂNG
(a) Ghi: Ghi bằng cách nhấn nút hành động nổi màu đỏ. Tìm dữ liệu đã lưu được lưu trữ trong biểu tượng thư mục.
(b) Xuất: Xuất dữ liệu bằng cách chọn một tùy chọn để gửi qua e-mail hoặc chia sẻ trong Google Drive hoặc Dropbox. Các tệp đã lưu cục bộ cũng có thể được chuyển từ biểu tượng thư mục.
(c) Thông tin về cảm biến: Nhấp vào biểu tượng (i) để xác định tên cảm biến, nhà cung cấp và tốc độ thu thập dữ liệu hiện tại, đồng thời tìm hiểu loại dữ liệu được cảm biến thu thập, nguyên tắc hoạt động vật lý của nó và các liên kết đến các tài nguyên bổ sung.
CÀI ĐẶT
* Lưu ý rằng không phải tất cả các cài đặt đều có sẵn cho tất cả các cảm biến.
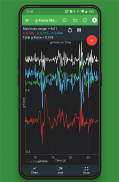
(a) Hiển thị dữ liệu: Xem dữ liệu ở dạng đồ họa, kỹ thuật số hoặc vectơ.
(b) Hiển thị đồ thị: Xem các tập dữ liệu đa chiều trên một đồ thị được chia sẻ duy nhất hoặc trong nhiều đồ thị riêng lẻ.
(c) Trục được hiển thị: Đối với dữ liệu đa chiều trên một biểu đồ được chia sẻ duy nhất, hãy chọn dữ liệu tổng, x, y và / hoặc trục z.
(d) Định dạng dấu thời gian CSV: Ghi lại thời gian đồng hồ hoặc thời gian đã trôi qua với dữ liệu cảm biến.
(e) Độ rộng dòng: Sửa đổi cách trình bày trực quan của dữ liệu với dòng Mỏng, Trung bình hoặc Dày.
(f) Tốc độ thu thập cảm biến: Đặt tốc độ thu thập là Nhanh nhất, Trò chơi, Giao diện người dùng hoặc Bình thường. Tốc độ thu thập cảm biến được hiển thị cho từng tùy chọn khi được chọn.
(g) Giữ Màn hình Bật: Ngăn ứng dụng tự động tắt màn hình.
(h) Hiệu chỉnh: Hiệu chỉnh các cảm biến đã chọn.
Physics Toolbox Sensor Suite - Phiên bản 2025.01.26
(26-01-2025)
Physics Toolbox Sensor Suite - Thông tin APK
Phiên bản APK: 2025.01.26Gói: com.chrystianvieyra.physicstoolboxsuitePhiên bản mới nhất của Physics Toolbox Sensor Suite
Phiên bản khác


 4.34
4.34


Ứng dụng cùng danh mục

Bạn cũng có thể thích...


